Unlocking Indonesia’s growth potential: low leverage, rich in resources, and market inflection in 2026?
Indonesia’s President Prabowo Subianto has an ambitious target to reach 8% annualised GDP growth by 2029. This would represent a sharp acceleration from an annual growth rate of ~5% for most of the past decade.
Chart 1: Indonesia’s annualised GDP growth
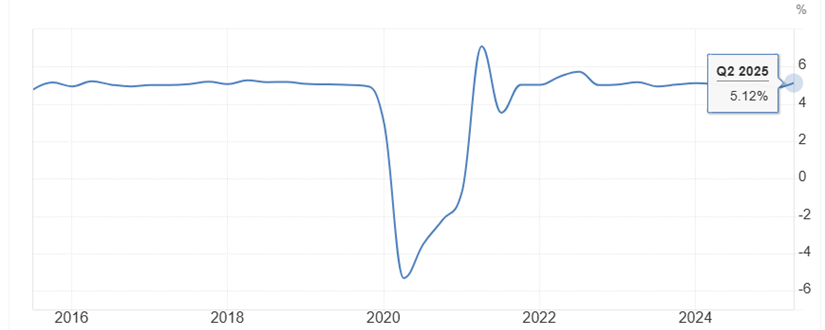
Source: Trading Economics.
Unlike other economies, however, Indonesia is one of the least leveraged countries in the world. With government debt-to-GDP below 40%, there is ample room to spend to lift economic growth.
Chart 2: 2024 government debt-to-GDP for selected countries
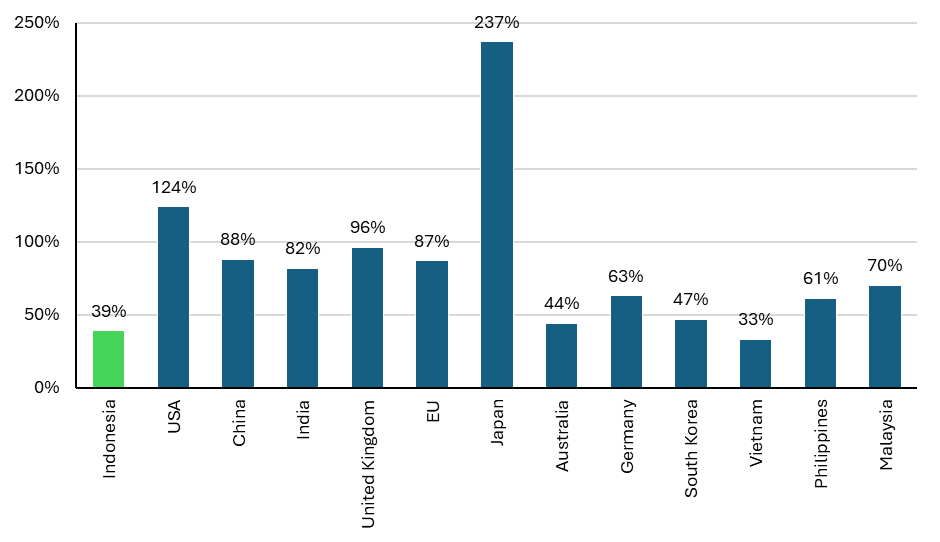
Source: Trading Economics.
Typical of years following the election of new Indonesian presidents, government spending and economic activity has been weak in 2025. This presents the potential for a rebound in 2026 as newly installed government ministers and SOE leadership teams begin to execute on key programs and strategies.
To support this growth agenda, a new growth-focused Minister of Finance, Purbaya Yudi Sadewa, took office in September 2025. We are beginning to see the initial impacts of his changes to monetary and fiscal policy, with money supply growth jumping from mid-single digits in August to nearly 20% YoY in September. This will likely help to kick-start the economy into next year.
Chart 3: BI adjusted M0 growth versus M2 versus loans growth (% YoY)

Source: BofA Global Research.
In addition to low leverage, Indonesia is rich in natural resources, notably critical minerals such as nickel. In an inflationary world, these resources represent assets to the Indonesian economy which can continue to fetch ever-higher prices, supporting a stronger current account.
Chart 4: Indonesia plays a significant role in the global supply of some mineral and agricultural goods

Source: International Trade Center, Ministry of Energy and Mineral Resources, USGS, CEIC, Goldman Sachs Global Investment Research.
Indonesia’s downstream verticalisation strategy to add value to its “rocks in the ground” has dramatically increased the export value of nickel-based products. As it moves up the value chain in different commodities, this can add material upside to the GDP growth outlook.
Chart 5: Nickel-related products export value increased ~8-fold since 2013 (left); Indonesia is a major producer of nickel, whose derivatives have high export value multiplier (right)
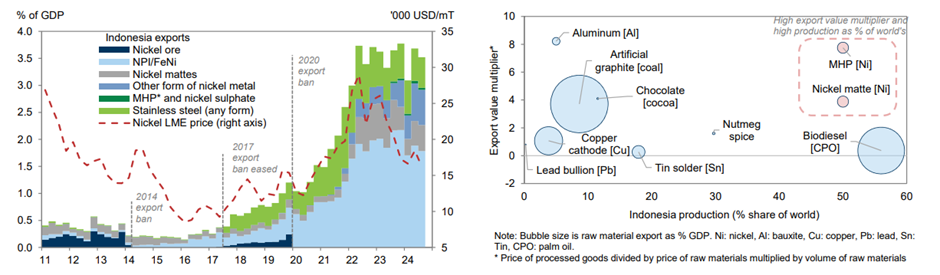
Source: International Trade Center, Haver Analytics, Goldman Sachs Global Investment Research (left); International Trade Center, Ministry of Energy and Mineral Resources, USGS, CEIC, Goldman Sachs Global Investment Research (right).
In light of temporary sluggishness in the domestic economy in 2025, we are finding highly attractive opportunities to own leading quality franchises in Indonesia. Some of these companies are generating dividend yields above 10% and delivering ROE approaching 20%, all while trading at discounted valuations.
Chart 6: Top yielding large cap APAC banks – FY25E yield (%)
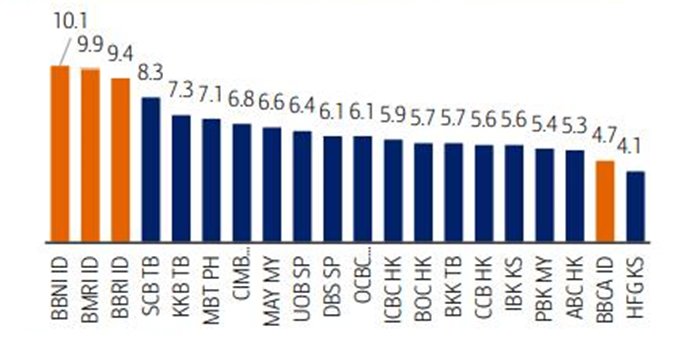
Source: BofA Global Research.
Indonesia represents an exciting emerging economy, with a huge population of more than 285 million, rich in sought-after resources. This can support strong economic activity and business earnings into the future, particularly in an inflationary world. Trading at depressed levels of <12x forward P/E, nearly 2 standard deviations below the 15-year mean, and with strong dividend yields in leading larger corporates, now is the time for investors to reconsider Indonesia. These kinds of valuations do not come around often!
Chart 7: Indonesia MSCI Index forward P/E
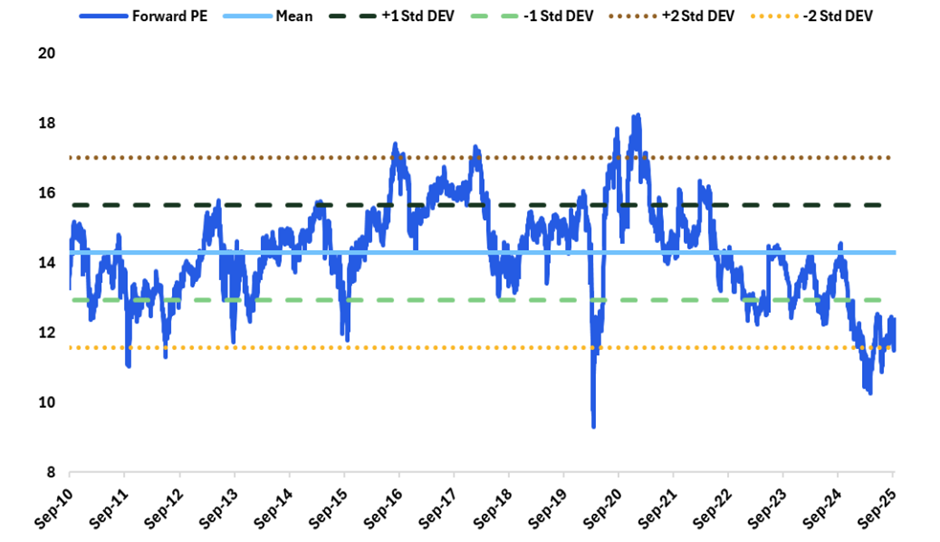
Source: Citi Research, Bloomberg.
At Ox Capital, we are focused on quality companies with long term growth which are available at inexpensive valuations across emerging markets. Current valuations are providing lots of interesting opportunities. Let us know if you would like to understand specifically where we are finding the opportunities!
Important Information: This material has been prepared by Ox Capital Management Pty Ltd (Ox Cap) (ABN 60 648 887 914) Ox Cap is the holder of an Australian financial services license AFSL 533828 and is regulated under the laws of Australia. This document does not relate to any financial or investment product or service and does not constitute or form part of any offer to sell, or any solicitation of any offer to subscribe or interests and the information provided is intended to be general in nature only. This should not form the basis of, or be relied upon for the purpose of, any investment decision. This document is not available to retail investors as defined under local laws. This document has been prepared without taking into account any person’s objectives, financial situation or needs. Any person receiving the information in this document should consider the appropriateness of the information, in light of their own objectives, financial situation or needs before acting. This document is provided to you on the basis that it should not be relied upon for any purpose other than information and discussion. The document has not been independently verified. No reliance may be placed for any purpose on the document or its accuracy, fairness, correctness, or completeness. Neither Ox Cap nor any of its related bodies corporates, associates and employees shall have any liability whatsoever (in negligence or otherwise) for any loss howsoever arising from any use of the document or otherwise in connection with the presentation.