Country in Focus: Indonesia
In the coming decade, Indonesia will enjoy multiple growth engines: the Omnibus Law encouraging investment, structurally higher energy prices to boost income, and the Digital Revolution creating new opportunities. These will drive significant consumption and urbanisation growth.
The Omnibus Law
The Omnibus Law was passed on 5 October 2020. Red tapes are often an obstacle in developing countries for foreign investment, and the Law is designed make it easier to invest in Indonesia and to create jobs.
The impact has already been felt through robust FDI throughout 2021 despite the ongoing pandemic. Indonesia’s FDI grew by 9% YoY as of September 2021, amounting to US$22.7bn. This has been led by the base metal and metal product sector (investments into nickel), which amounted to ~US$5bn FDI realization (781 projects) as of September 2021.
The Law also creates an Indonesian Sovereign Wealth Fund – the Indonesia Investment Authority (INA). The Government has injected US$5bn of capital in cash and kind (in the form of State bank shares). The INA is undertaking investments with partners to build infrastructure, toll road, seaport, airport, etc. Many developing countries are short infrastructure and lifting infrastructure endowment can do wonders for productivity of the country.
Higher Energy and Commodity Prices
Figure 1: Australian and Indonesian coal prices ($/ton)
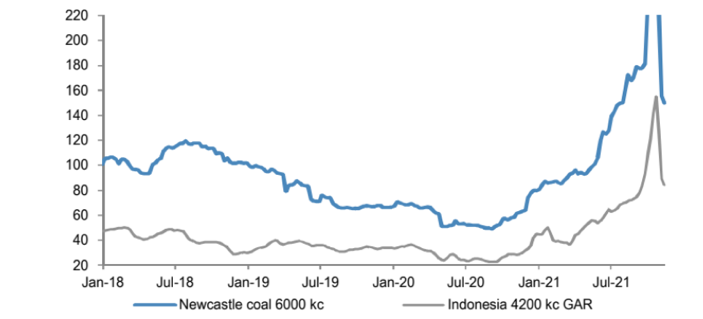
Source: IHS energy, Bloomberg Finance L.P.
Figure 2: Global thermal coal import share
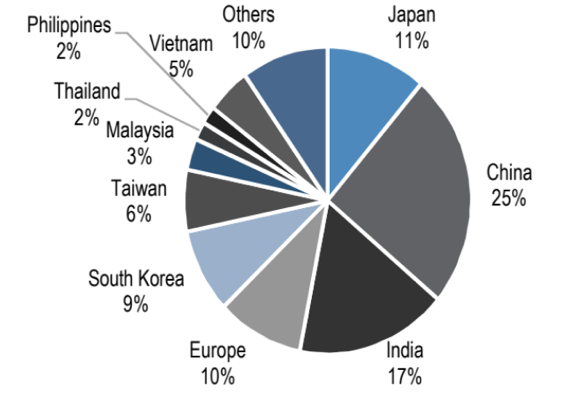
Source: Bloomberg Finance L.P., WoodMac, J.P. Morgan estimates.
Figure 3: Indonesia monthly coal exports (mn tons)
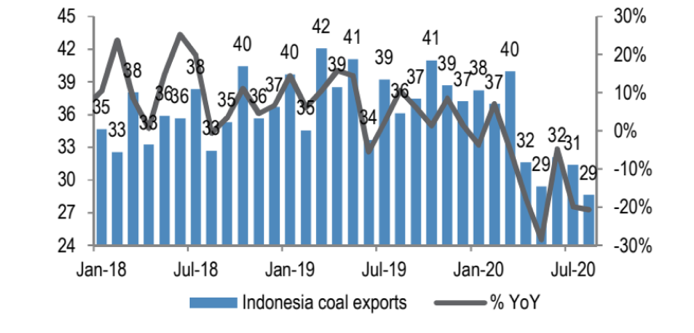
Source: Bloomberg Finance L.P.
Figure 4: China monthly coal imports (mn tons)
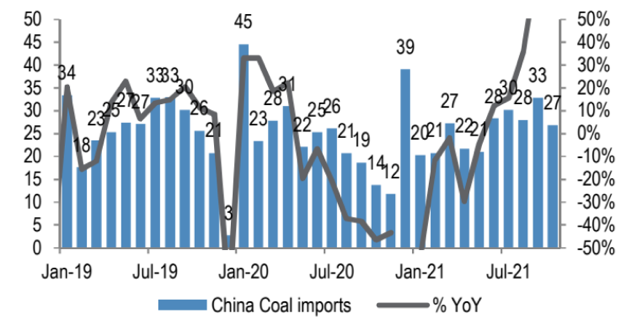
Source: Bloomberg Finance L.P.
Figure 5: Coal price y/y vs 6mma 4W sales y/y; strong relationship through multiple cycles
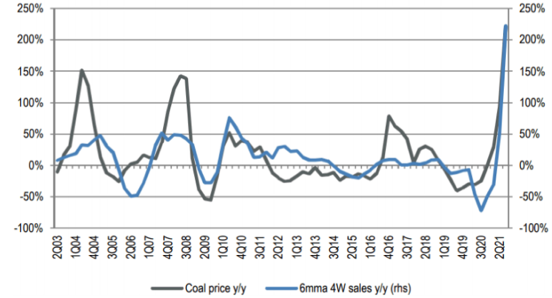
Source: Bloomberg Finance L.P., Gaikindo.
Figure 6: Coal price y/y vs 6mma 2W sales y/y; strong relationship through multiple cycles
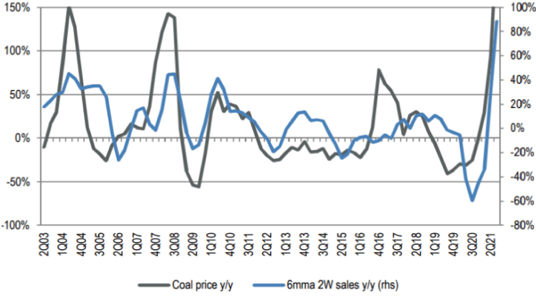
Source: Bloomberg Finance L.P., Gaikindo.
Indonesia is a major player in the seaborne coal market. While the long-term outlook for coal is negative given the move to carbon net zero, we will likely see structurally higher prices as coal continues to be undersupplied due to a lack of incentive by the market to fund capacity growth. As a major palm oil exporter, Indonesia significantly benefits from rising oil prices.
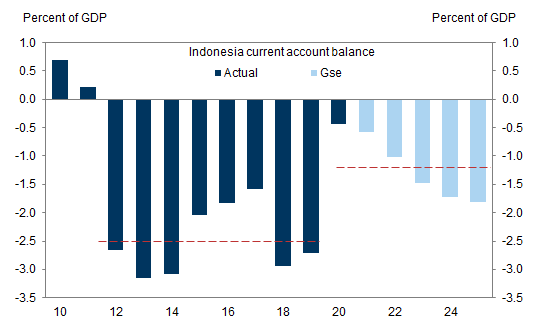
Higher energy prices are already doing wonders for Indonesia’s current account position, and thereby the attractiveness of its sovereign bond and Rupiah’s stability.
Figure 7: Indonesia Current Account balance as % of GDP
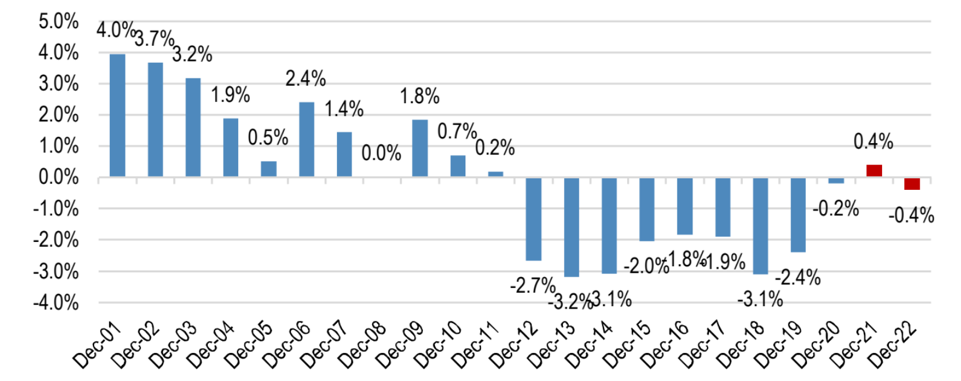
Source: Bloomberg Finance L.P., J.P. Morgan estimates.
Figure 8: IndoGBs are the only major EM local bond market notably stronger than pre-pandemic levels
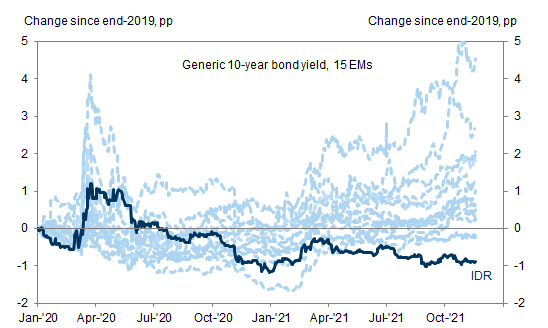
Source: Haver Analytics, Goldman Sachs Global Investment Research.
Figure 9: Sustained terms of trade gains could keep the CA deficit lower than pre-COVID averages of 2.5% of GDP
Source: Haver Analytics, Goldman Sachs Global Investment Research.
Figure 10: Global nickle production – Indonesia accounts for 30% in 2020
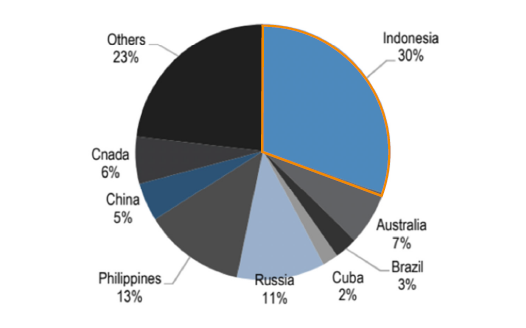
Source: USGS.
Figure 11: World’s nickel reserve – Indonesia accounts for 22% (no.1)
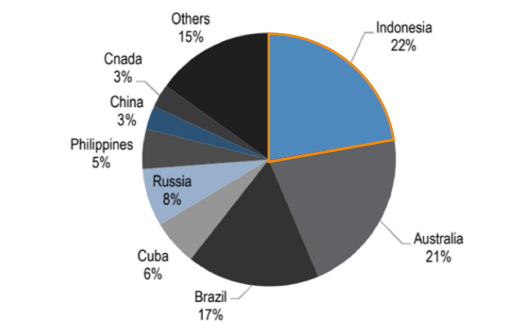
Source: USGS
Indonesia is also endowed with nickel ore. Its accounts for 30% of total global production and 22% of world’s reserve according to United States Geological Survey. Most of the nickel in Indonesia is mined in the islands of Sulawesi and Maluku, where raw ore is processed into NPI (Nickel Pig Iron, 8-12% nickel content), FeNi (20-40% nickel content) and Matte before being used for the downstream stainless steel industry or exported.
Figure 12: World’s nickel reserve by type
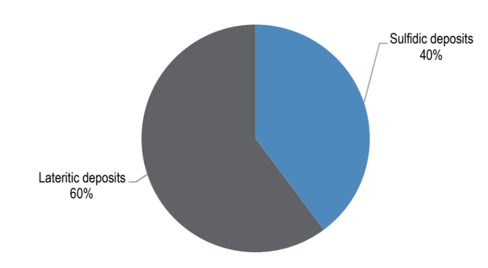
Source: Nickelinstitute.org
Figure 13: Nickel uses – 2020
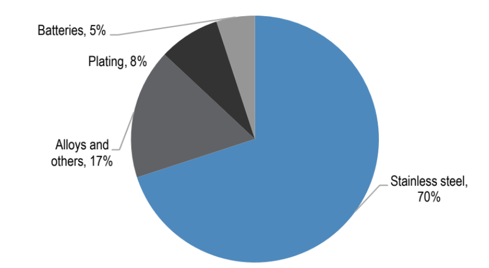
Source: Nickelinstitute.org
Indonesia is therefore well positioned to take advantage of the electric vehicle revolution. EVs require ~7-15 kg more nickel compared to an ICE car and overall consume ~25-30kg of nickel/car.
Batteries consume 5% of global nickel production and this will increase to around 20% with higher EV penetration globally. Indonesia Battery Holding Corporation is the Government’s attempt to turn Indonesia into a major battery hub.
Table 2: Nickel demand from green technologies
| 000 metric tonnes | 2020 | 2021 | 2022 | 2023 | 2024 | 2025 |
| EV | 108 | 167 | 233 | 322 | 440 | 556 |
| Storage | 10 | 17 | 26 | 32 | 34 | 27 |
| Consumer electronics | 18 | 20 | 23 | 24 | 27 | 29 |
| Total green nickel demand | 135 | 204 | 282 | 378 | 501 | 612 |
| Total nickel demand | 2,402 | 2,712 | 2,875 | 3,005 | 3,192 | 3,362 |
| Green demand as a % of total | 5.7% | 7.5% | 9.8% | 12.6% | 15.7% | 18.2% |
Source: IHS, BNEF, NEA, Tsinghua University’s Institute of Energy, Environment and Economy (3Es), Carbon-neutral Pathways for the United States, CRU, Wood Mackenzie, J.P. Morgan Commodities Research.
Figure 14: Global xEV forecast
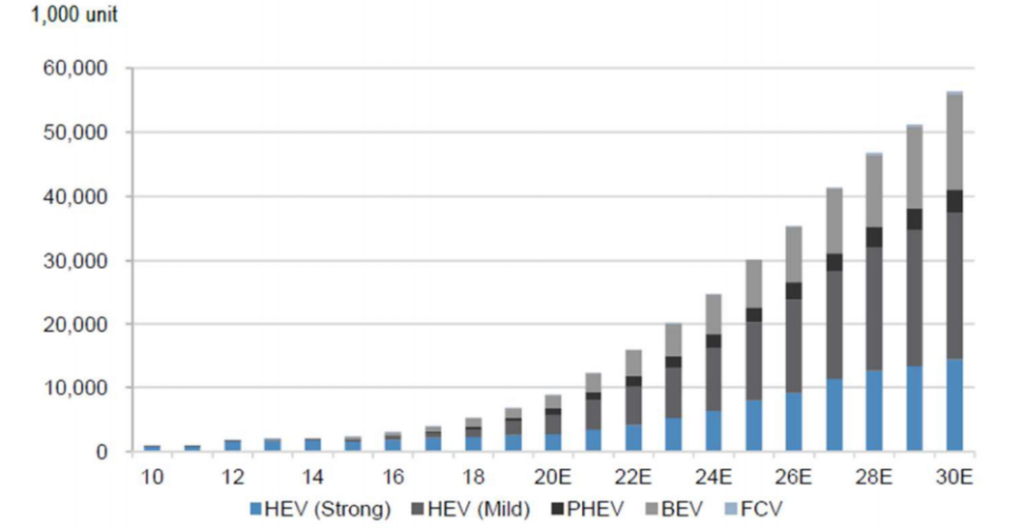
Source: J.P. Morgan estimates based on Autodata, JADA, CAAM, KAMA, TWMA, SIAM, Astra, CAMPI, Toyota Motor Thailand, VAMA, Marklines, HIS Automotive.
The Digital Revolution
Indonesia’s Internet economy has grown significantly from ~US$8bn in 2015 to ~US$60bn in 2021 but this is still under penetrated (5% of GDP).
Indonesia has four big tech giants:
- Gojek (SuperApp/ Ride-Hailing) – backed by Tencent, JD.COM, Astra International, Telkom, VISA, Facebook, KKR
- Tokopedia (E-Commerce) – backed by Softbank, Alibaba, Google, Temasek
- Traveloka (Online Travel Agent) – backed by Expedia, JD.COM, GIC
- Bukalapak (E-Commerce/O2O) – backed by Emtek Group, Ant Financial, GIC, Microsoft
Figure 15: ASEAN’s internet economy size (US$bn)
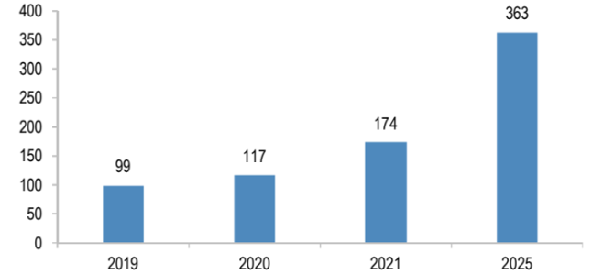
Source: Google, Bain, and Temasek
Figure 16: LAst reported equity value of ASEAN TMT unicorns and ‘soonicorns’ (US$mn)
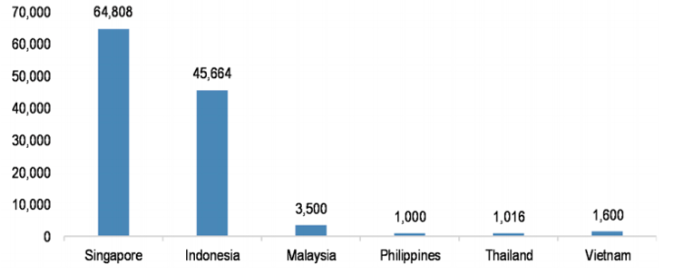
Source: Company releases, media reports
Figure 17: Banks applications & fintech application growth (%y/y)
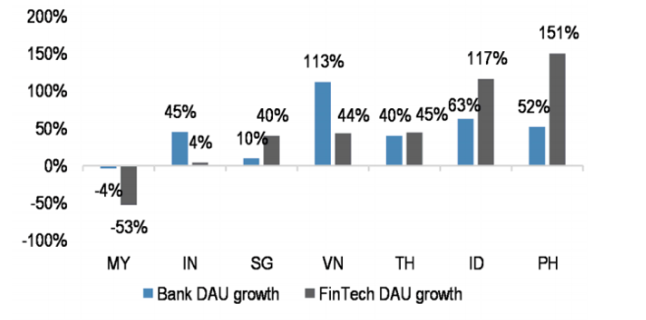
Source: Apptopia, J.P Morgan. Note: MY declined due to Touch ‘n Go, which is used for public transport and toll payments.
Figure 18: SPAC deals for Asian companies
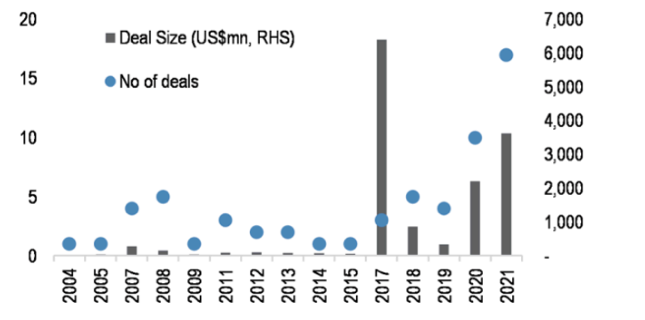
Source: Bloomberg Finance L.P. Note: These are completed SPAC IPOs of firms domiciled in Asia but listed in US. Data for 2021 is YTD as of 12 July 2021.
Table 2: Summary of Indonesia’s tech giants
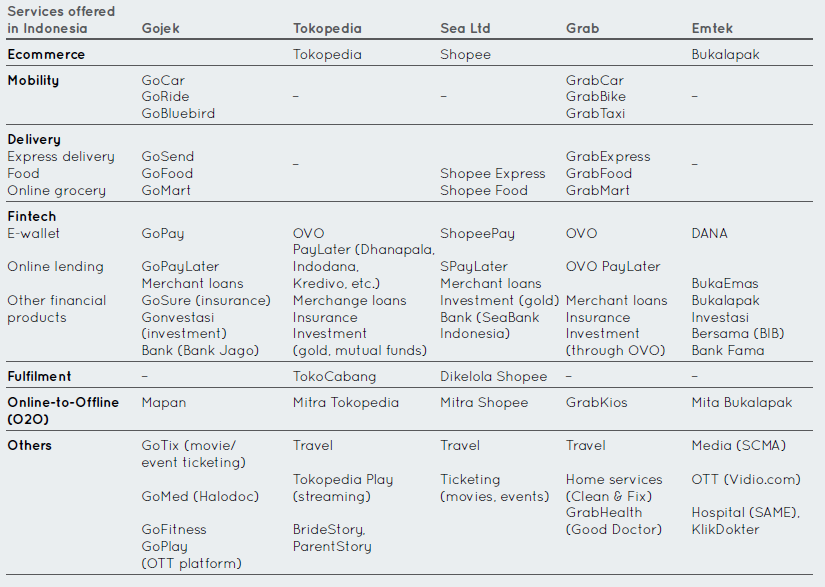
Source: Company apps. The list may not be exhaustive.
This material has been prepared by Ox Capital Management Pty Ltd (ABN 60 648 887 914 AFSL 533828) (OxCap). It is general information only and is not intended to provide you with financial advice or take into account your objectives, financial situation or needs. To the extent permitted by law, no liability is accepted for any loss or damage as a result of any reliance on this information. Any projections are based on assumptions which we believe are reasonable but are subject to change and should not be relied upon. Past performance is not a reliable indicator of future performance. Neither any particular rate of return nor capital invested are guaranteed.